Perfect Foresight?

This is the time of year when Callan LLC publishes their annual “Periodic Table of Investment Returns” (see chart below).  It is a colorful mosaic quilt of annual investment returns for the major asset classes arrayed by year by return.  It is most instructive to show the variability of returns for each asset class in comparison to the others.  For example, you can observe from the medium blue box labelled Large Cap Equity (S&P 500) that annual returns over the last 20 years have varied from -37.00% in 2008 to +32.39% in 2013.

Given all this great data, there are a few other observations and calculations I like to highlight:

  1. The variability of return of Large Cap Equity calculates to an average annualized return of +9.80% over the last 20 years.  But, that comes with a large annual standard deviation (risk) of return of 16.75%; meaning there is a high probability of returns varying around the average easily dipping into the negative return region - something we can easily observe from the chart and have seen in 2022!

  2. Cash Equivalent (the light blue box), as the least risky asset class, fulfills its role as a stable floor of returns with average annualized returns of +1.27% over the past 20 years.  Cash Equivalent was the best performing asset class in 2022, but if an investor can tolerate some risk over a long time horizon, there are other places to earn more return.

  3. As reported almost everywhere in the financial press, U.S. Fixed Income (the teal box) had a historically weak return in 2022 of -13.01% compared to its average annual return +3.10%.  Not surprisingly, from the chart you can see that this asset class actually was the best performing asset class in 2008, a very bad year for equities!

  4. Finally, if we had perfect foresight and were able to pick the best performing asset class each year, the calculated average annual return would have been an amazing +26.26% over 20 years!  Of course, no one can do this, but it is certainly fun to think about!

As the chart shows, asset class returns are variable and switch places on an almost random way.  It is always best to have a well-diversified portfolio of investments that are managed to a risk target that is designed to help you achieve your goals.

Is THIS the year for Emerging Market Equities?

I knew a very sharp portfolio manager who used to say, “I re-buy my portfolio every day”!  By that, he meant that he regularly checked all the holdings in his portfolio to evaluate what he liked and what he didn’t like.  If something had changed, he would evaluate if the portfolio needed a change.

This is a complicated problem at the portfolio level.  It is not just ONE holding, but a group of holdings that are all positioned to inter-relate with each other.  Ideally, some will zig when others zag, and vice versa.  In fact, if we are properly diversified, it is almost a certainty that there will be SOMETHING that has shown disappointing performance, but still serves a place in a portfolio as a diversifier over a longer time frame.

For example, emerging market equities have been on everyone’s list the past few years as an asset class that is “cheap” and ready for a “pop”.  As we know, per the chart below, that has not been the case as annualized returns of emerging market equities (SCHE, -0.3%) have struggled and underperformed the U.S. markets (IVV, +8.5%) by a wide margin over the three years since January 2020.  However, if you go back a few years to 2017, emerging markets were a legitimate darling that year with a total return of +37.3% besting the U.S. markets return of +21.8%.   And also, on a year-to-date basis this year, emerging market equities (SCHE) are up +8.7% beating U.S. large cap (IVV) of +4.2%.

We hold asset classes like emerging market equities because we believe they have a low correlation with core holdings like large cap U.S. equities (IVV) and “will zig when others zag”.  In fact, long term correlations of emerging market equities do exhibit that quality with a long term correlation coefficient to U.S. equities of 0.74 over the past 20 years.  This is not as low a correlation as core U.S. bonds (AGG) of 0.16, but is still relatively low for the equity space.

As always, we believe that patience will serve long term investors well.

A Disappointing 2022

The 4th quarter of 2022 offered a bit of respite to weary investors in 2022 due to positive pops in October and November, but December quickly showed no mercy as negative momentum kicked in and tempered any optimism of ending the year on an upbeat.  The themes of 2022 continued during Q4 as volatility reared its ugly head with market interest rates moving up, from down, and equities moving down, from up.

We have become accustomed to the usual suspects of inflation fears, a hawkish Fed, rising market interest rates and the global geopolitical and economic consequences from the Russia/Ukraine war playing havoc with capital markets.

 Though 2022 Q4 shows some “positive” quarterly total returns for the major asset classes, the results are far from inspiring and not necessarily indicative of an inflection point.  Per the table below, the major asset classes showed Q4 returns that were “in-the-black”, but not by a wide margin and certainly not enough to compensate for the overall weakness we had seen over the entirety of 2022.  For example, during Q4 the S&P 500 (IVV) was up +7.59% and core bonds (SCHZ) was up +1.68% but those asset classes were both down a LOT over all of 2022 at -18.16% and -13.17%, respectively!  The weakness in bonds is historic; worst annual return ever!

My blog post on November 28 posited the thought, “Is the Bottom In?”  In it, I showed three separate market bounces that naively foretold more market gains, but resulted in losses!  Forecasting market returns is really HARD, but practically speaking is mostly a “conditional” game; if this, then that.  If you luckily guess the conditions correctly, then maybe you will be lucky guessing market outcomes. 

Per that blog post, themes that could change that could impact markets include:  hawkish centrals banks fighting inflation, higher rates, tighter liquidity, weaker financial conditions suggesting downside risk to earnings and potential for severe recession, unattractive credit spreads, currency-induced sovereign crisis and escalation in Russia/Ukraine war. So, stay tuned!

"Play the Hand That You're Dealt"

No one likes to lose money but, as they say, you must “play the hand that you’re dealt”.  If you are a long term investor, it is likely you have some built up unrealized gains over the years.  For example, despite the S&P 500 being down -16.3% so far this year, it is still up +31.2% cumulatively over the last three years.  Conversely, unfortunately, some diversifying positions have not done so well!  This includes emerging market high dividend equities (DVYE) that are down -20.9% cumulatively over the past three years, while being down -31.0% this year alone.

The tax codes do allow some respite for taxpayers with investments in taxable accounts through the deduction of up to $3,000 of net realized losses against ordinary income.  In this current year, it certainly makes economic sense to take this tax loss selling to save a bit in taxes.

Another, less utilized, tax loss selling strategy is to realize GAINS on long term holdings and immediately buy them back at the higher cost basis while offsetting the gains with tax loss selling.  The net result of this kind of transaction is to raise the cost basis so that taxes will NEVER be paid on those realized gains.  Let’s run through the rationale for this kind of transaction.

If a taxable investor has a taxable account with $100,000 in unrealized gains, he could realize the gains and have a net after-tax gain of $80,000 (assuming a 20% tax rate).  But, if there are $100,000 of other realized losses in the portfolio he could offset the gains completely and NOT pay the $20,000 tax in the current year.  Going forward, the $100,000 of realized gains are completely sheltered from taxes and the $20,000 in realized gain tax will NEVER be paid on that $100,000.  Of course, the investor would much prefer there being NO offsetting losses against the $100,000 unrealized gains, but at least this is a way to make the best of other losses existing in the portfolio.

This is NOT tax advice since there are many other investor-specific issues to consider, including wash sale rules, taxable situation, overall portfolio management and risk preferences.  I do not recommend this as a DIY transaction since there are many pitfalls.  D&A manages all client taxable accounts with a “tax-aware” strategy.

Is the Bottom In?

In the face of this horrible year with the S&P 500 (IVV) currently down -14.30%, we have had some decent mini-rallies.  For example, from March 14 through March 29 we saw the S&P 500 go up +11% and from June 16 through August 18 it went up +17% (see chart below).  We are seeing another mini-rally now with the S&P 500 currently up +13% from a recent low on October 12.  So, is the bottom IN and will this rally take us to new highs or is this another rally to be short-circuited by any of the troubles facing the markets?

I read an interesting article this weekend published by Wellington Management, a multi-billion dollar global investment manager based in Boston, titled Inflation, rates, and volatility: The best defense is a good offense.  Aside from the title, the gist of the article deals with the large number of binary events we are facing that will dictate the course of the global economy.  Several of them are summarized below:

  • Hawkish centrals banks fighting inflation

  • Higher rates, tighter liquidity, and weaker financial conditions suggesting downside risk to earnings and potential for severe recession

  • Unattractive credit spreads

  • Currency-induced sovereign crisis

  • Escalation in Russia/Ukraine conflict

All we need to do is switch the “negative” tone to a “positive” tone in a few of those bullets to see a turnaround in the market outlooks.  The article implies that the potential for market dislocations from these major items could cause a need to act swiftly with some tactical repositioning.

Though D&A has a strong philosophical bias to focus on long term strategic positioning, there are opportunities to act tactically. For example, earlier this year, D&A made a commitment to shorten bond duration for all client accounts given the risk/return profile displayed by the flat yield curve (long bonds compared to shorter bonds) (see recent blog posts, including It’s Complicated, and others). In other ways, for taxable accounts, given the large market drawdown this year, there is a potential for advantageous tax loss selling. We will continue to monitor market dynamics and adjust portfolio positions to advantage all client accounts.

Retirement-Ready?

2022 has been a tough year for anyone thinking about a near-term retirement. Though you may have visions of volunteering, diving into new hobbies, playing golf every day, or simply owning your own time to do whatever you want, you still need to be able to AFFORD the expenses that come with all of it.

We at D&A take retirement very seriously and provide full investment retirement plans with industry-leading software to help ease the financial decision-making process.

We help you identify your projected basic expenses in retirement and plan for other financial goals like travel and major purchases. On the income side we help you decide on your social security claiming strategy and model out other sources of income like part-time work and pensions. Finally, we take a look at your investment portfolio and help ensure that it has the appropriate risk profile to match your risk tolerance and need for return.

After everything is thought through, we run 1,000 different investment scenarios to calculate your “probability of success”, i.e., the probability that you will have enough income and investments to fund all of your expenses and goals through to your end of plan.

For more information on our investment retirement planning, please take a look at this link to our 5-minute video (here) where I walk through a sample case.

FAANG-tastic? Not!

There are a lot of big stories this year!  As you might expect, all of them are interrelated like high inflation, high interest rates, tightening Fed, Russia/Ukraine war, and weak stock and bond markets.  One of the most interesting underlying facets of this most troubling year is the performance of growth stocks, in general, and the performance of the “FAANG” stocks, in particular.

The “FAANG” stocks were coined when a few high-flying growth stocks started putting up very high total return numbers.  The FAANG stocks were Facebook (now Meta, META), Apple (AAPL), Amazon (AMZN), Netflix (NFLX), and Google (now Alphabet, GOOG).  These stocks were not only producing high returns for their investors but were also growing to be some of the largest market capitalization stocks in the U.S.

But, oh how the mighty have fallen (mostly, except Apple)!  As seen from the chart below, the good times are now a distant memory.  Over the past 24 months, four of the FAANGs have struggled off their recent highs with significant “drawdowns”, i.e. recent peak-to-trough.  Certainly, Facebook/Meta, Amazon, and Netflix all show very large negative average annual returns of -31.6%, -15.1%, and -21.8%, respectively, over the past two years, but the drawdowns of -66.8%, -45.2%, -53.4%, respectively, and -37.1% for Google, are especially telling of the risk embedded in those stocks.  Over this time horizon, the S&P 500 (IVV, the green line) showed an average annual total return of +7.7% with a drawdown of only -24.5%, while Apple, the best-performing FAANG, is actually up +14.6% with a drawdown of only -28.3%.

All of the FAANG stocks are included in the S&P 500, so those weak recent returns are part of the performance of the index.  In fact, in order to be properly diversified, it makes sense to have had some exposure to this group while they were in their high-flying stage because over a LONG time horizon these stocks have supported positive index returns (except Facebook/Meta, that recently showed very significant idiosyncratic weakness due to a strategic shift in their business).

So, this is just another example of how being a diversified long term investor is to your benefit.  It was mathematically infeasible for those stocks to have continued at the growth pace they put up early in their formative years, but no one could guess when the growth would slow; or when it might pick up again?  Historically, owning a well-balanced portfolio of high-quality stocks and bonds captures the go-go years, as well as the “off” years, that has netted out to positive market returns over a long time horizon.

Bonds Down, Stocks Up?

Friday October 21 ended a week that was quite unusual within the context of normal market dynamics and is quite the talk in cyberspace over this weekend.  Over the course of this very difficult year, as bond yields rose (and prices cratered!), the stock market had followed suit.  However, we observed quite the opposite last week.

As seen from the chart below, over the course of last week stocks (SPY, the green line) popped +4.7% while long Treasury bonds (TLT, the gold line) sank -5.5%.  Interestingly, the long bond ETF traded this way on very high volume, especially on Friday!  During this time, core bonds (AGG, the blue line) hung in the middle ground with a modest loss of -0.9% total return.  

This kind of conversation is usually reserved for market timers and “technicians”, those market participants who try to discern future market moves based on recent trends.  Some view this large sell-off in bonds as a “capitulation” indicator calling a bond “market bottom” and a bullish sign for stocks. Others thought it was simply the Bank of Japan selling Treasuries to buy yen to support the yen, likewise a bullish sign for stocks.  Still others call this a “bear steepening” where long rates go higher faster than short rates indicating higher inflation but early signs of an economic recovery.  Interestingly, most market commentators are calling this a “bullish” sign for stocks.

Of course, we are all very good at telling a story about what happened in the market, but not too good at getting the reason right, and especially not too good at predicting the future outcomes!   As I have relayed all year, history has proven that long term investors in a diversified portfolio of high-quality risk-managed investments will be rewarded over time.

It's Complicated!

We all know the risk of holding long bonds when rates rise: the prices go down!  So, given the Fed’s clear mandate to raise rates until inflation subsides to the 2% range, why hold long bonds?  It’s complicated!

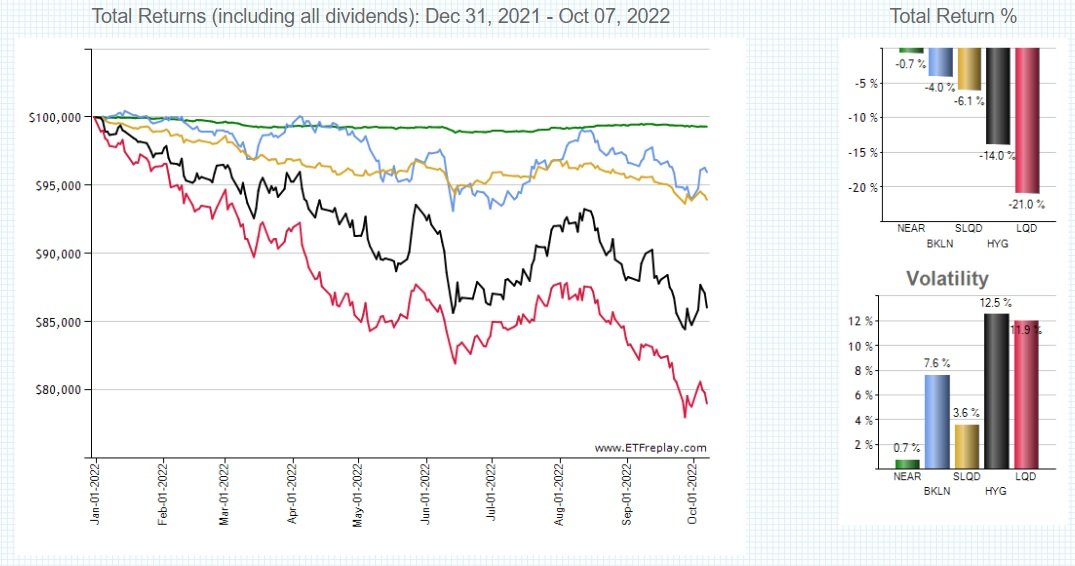
It is no secret that bond prices have been on a downward trend almost all year.  As you can see from the chart below, different categories of bonds have performed quite differently; some mirroring equity returns!  From very short to long, very short bonds (NEAR, 0.42 years duration) have lost almost no value during 2022 at a total return of -0.7% whereas investment grade corporate bonds (LQD, about 8.35 years duration) produced a total return of -21.0%!  Other bond categories such as bank loans (BKLN, -4.0%), short investment grade corporate bonds (SLQD, -6.1%) and high yield bonds (HYG, -14.0%) produced varied returns mostly a function of their durations and other characteristics like structure, credit quality, liquidity, and supply/demand.

During the post-Credit Crisis environment of 2008/09, most thought leaders were bemoaning the inflationary and higher interest rate threat being fostered by an easy Fed.  During the next 10 years that inflation threat never emerged.  Likewise, in the post-Covid era the same views permeated the landscape.  This time, of course, huge fiscal stimulus accompanied an easy Fed and the clogged supply chains caused a global economy to struggle to produce enough goods to meet demand exacerbating inflationary pressures.  Also, it is difficult to quantify the impacts of the Russia/Ukraine war or the strong dollar, but they both have positive and negative effects.

Strategically, holding long bonds is mostly a decision tree exercise.  If rates rise, because the markets have an expectation of rising inflation, then bond values will fall.  Conversely, if rates fall due to lowered inflationary expectations, bond values will go up!  Or, alternatively, rates could go up or down for a variety of other reasons like a Fed “mistake” of too much/too little tightening or a “flight to quality” propagated by an escalation in geopolitical tensions, or even a “black swan” event that no one can contemplate today. Simply, we hold long bonds in the case that rates fall; the timing of an event that we can not predict.

Because D&A believes in a well-diversified approach to portfolio management, no client portfolio is ever over-weighted in any one sector of bonds, or stocks, such that the direction of interest rates is less important than otherwise. Most client accounts have exposure to different bond sectors included in the chart above, as well as cash and other sectors like preferred stocks, to manage the portfolio risk profile to help clients achieve their goals.

"Sea of Red”, Part II

Like the last two quarters, markets struggled in Q3 due to rising rates, inflationary fears, and geopolitical turmoil from the Russia/Ukraine war.  Mid-June to mid-August saw the markets rally on hopes of a less-hawkish Fed engineering a soft economic landing to quell inflation, but the Fed chairman put an end to that thought with his new tough talk as an “inflation fighter”.

 Other global considerations such as persistent covid outbreaks in China, energy dependency and shortfalls in the Eurozone, and continuing supply chain disruptions also played out on the global scene impacting global markets.

 The “Sea of Red” (Part 2!) persisted during Q3.  As seen from the table below, all major asset classes generated negative total returns during Q3 and on a year-to-date basis.  The most telling observation from the table is the weakness of bond returns in comparison to stocks.  While the S&P 500 (IVV) was down -4.91% during Q3, core bonds (SCHZ) were down just about the same at -4.76%; investment grade corporates (LQD) were down even more at -6.15% due to a widening credit spread amidst fears of a weakening economy.  The only “respite” was from short term investment grade corporate bonds (SLQD) with a -1.71% return mostly due to its shorter duration compared to LQD.  Cash, of course, produced a 0% return during Q3 but offered no potential as a diversifier.

D&A did NOT “do nothing” in the face of the seismic shift in the markets.  All client accounts traded a weighting of long bonds for short bonds and built up cash; actions that were positive contributors to return during Q3.  But, like the market, all accounts are negative on the year.

 Just like last quarter, my blog posts during Q3 had a decidedly negative bias with positive overtones.   Yes, it is upsetting to see negative returns eat away at your investments, but as long as the investment strategy is consistent with your risk profile, time horizon and investment goals it is better to sit tight since history shows that long term investors are rewarded for their patience.

"Maximum Uncertainty"

Financial commentators have plenty to muse over given the current financial, economic, and geopolitical environment we are in.  Though the markets are ALWAYS wrought with unknowns, this period of time does seem to be more tenuous.  Following are a few notable thoughts from noteworthy thought leaders:

  • Kevin O’Leary, of “Shark Tank” fame, is a well-known investor and financial commentator.  He was on CNBC a few days ago and proclaimed that this is a period of “maximum uncertainty".

  • Jim Cramer, another CNBC contributor, recently tweeted about the three things he needs to see resolved before he sees a better environment including the Chinese taking the Moderna vaccine, Putin out of Ukraine, and the Fed goes on hold.

  • Michael Gayed, notable portfolio manager, recently tweeted, “The hell isn’t the bear market in stocks.  It’s the interaction against Treasuries, the risk-off asset, that makes it hell.”

The list could go on, of course, but these few ideas highlight the difficulties facing the financial markets as it strives to normalize and resume an upward trend.  No doubt, this market is painful!  But, at the risk of repeating myself from my Three Thoughts blog post in July and numerous other posts, here is a closing thought:

“you have all heard it from me many times to hold tight since no one can time the market, no one rings a bell when it is time to get back in, and based on history, long-term investors will be rewarded for sitting tight.” 

Note:  This is another post without a “downward sloping trend line”!  We have seen enough of those!

What's the Fuss with I Bonds?

When inflation started picking up last year, every blog writer and financial columnist started writing about U.S. Treasury I Bonds.  For example, in a recent CNBC article Suze Orman said, “I Bonds are the one investment everyone should have right now.”  At the risk of being ostracized by the financial intelligencia, following are a few blemishes on this perfect “rose”.

I Bonds are U.S. Treasury-guaranteed bonds that pay a rate linked to the inflation rate (Urban Consumer Price Index).  In fact, the “headline” interest rate today for new Series I Savings Bonds is 9.62% (annualized) for bonds bought before the end of October (for much more info, please go to the TreasuryDirect website).  However, there is much more to this rate than meets the eye!

Importantly, the quoted “annualized” rate is misleading for an unsophisticated investor.  In fact, today’s headline rate of 9.62% is really only 4.81% for the 6 months through March 2023.  At March 2023 the rate will be replaced for 6 months by whatever the inflation rate is (plus a fixed rate component that is currently 0.00%).  So, it really is a version of a simple 6-month bank CD that re-sets every 6 months for the next 30 years.  Granted, the 4.81% rate today is still pretty good for a 6-month CD!  But, if the Fed is successful in reducing inflation, it is a certainty that the rates for these I Bonds will be lower at the next rate reset.

Additionally, like bank CDs, as you would expect there are restrictions.  For I Bonds that are cashed before 5 years, you lose the last three months of interest as a penalty.  Also, none of the I Bond interest earned is “spendable” unless the I Bond is redeemed (with the income federally taxed); a negative if you plan to use the income to help fund living expenses.

Secondly, for investors with a high net worth these really aren’t worth the bother.  The Treasury limits annual purchase amounts to $10,000 per social security number.  So, for a well-to-do investor with $1,000,000 saved for retirement, that equals only a 1% portfolio allocation; not something to get too excited about from a total portfolio perspective.  Plus, it is illiquid for 5 years (within when a 3-month interest penalty is assessed) making it not a very good high yielding cash proxy.  Of course, if your portfolio is smaller it could have a larger portfolio impact and be more meaningful or, conversely, be less meaningful if your portfolio is larger.

Additionally, if you are younger (with a 10+ year investment horizon) and have a smaller investment portfolio and are saving for retirement it is probably better for you to ignore bonds altogether and have a retirement portfolio invested 100% in equities, anyway!

So, like any investment, I Bonds have pros and cons and whether it makes sense for you depends on your investment profile and goals.  Yes, the 4.81% rate today for 6 months is pretty good and should be considered as an investment, but it is not for “everyone.”

I Bonds make the most sense for someone with a small investment portfolio who doesn’t need the money (or earnings from it) within the next 5 years and is looking to supplement their current fixed income allocation with an inflation-adjusted component.  They must recognize that if inflation moderates so will their earnings such that it might underperform bank CDs or other fixed income over their time horizon.  It could be that today’s 4.81% could end up being some kind of a “teaser rate” to get you in the door!  For a large investment portfolio, the $10,000 maximum annual limit plus all the other caveats make it not worth the trouble.

Note:  I Bonds are only available as a do-it-yourself purchase directly from the U.S. Treasury.  D&A cannot buy these investments for client accounts.

Old Days

The lyrics of the old Chicago song Old Days sound hopeful by recounting the past.  During times like this it is sometimes difficult to think about anything positive!  

Most D&A clients got a hopeful email update in late July extolling the positive trends we had seen in the markets after a miserable first half of the year.  However, the giddiness of July turned to dismay in August as markets retracted due to clearly hawkish statements by the Fed in its determination to slow economic growth to quell inflation.  The Ukraine/Russia conflict and its adverse impact on geopolitics, energy markets and global economies added to the negative bias.  So, nothing new here; we have seen this movie before!

By now, we have all seen enough “seas of red” and downward sloping trend lines for a lifetime.  I will NOT accompany this blog post with any of that material!  But, I will highlight the highly unusual and unavoidable fact I have reported all year and in No Zig that “bonds have performed almost as badly as stocks.  There has been no “zig” to offset the zag!”  Year-to-date, investment grade corporate bonds (LQD) are down -16.2%, exactly the same as the S&P 500 (IVV) at -16.2%.  Interestingly, we have seen pockets of relative outperformance (short bonds, SLQD), but they have been accompanied by relative underperformance (international markets, SCHF) impacting all diversified portfolios.

What do we do?  Philosophically, my views are unchanged; the best approach is to think long term.  One of my favorite books, The Rational Optimist by Matt Ridley, chronicles the history of human adaptability to improve its lot.  For example, he presents at length the impact of how innovation has improved the quality of life and incomes over time and how the rate of change continues to accelerate.  Of course, none of us has centuries (though some of you DO have decades!) to see a recovery!

But, as I said in No Zig, “As bad as it has been, if you have a long time horizon (10 plus years) and capacity for risk (employed, with no need to tap your investments), history shows that “sitting tight” will reward the patient investor.  No guarantees, of course!”  If you have a shorter time horizon and a special situation, we develop a special plan to help you achieve your goals.

Strategic Bond Math Update

I am a “bond guy” from way back.  I managed investments for insurance companies for about 30 years and most of my time was spent making sure that the risk/return profiles of the bond portfolios that we held were consistent with the needs of the liabilities that they were backing.  This experience transfers nicely to helping me manage bond exposures for D&A clients.

I have written a lot of blog posts recently on bond characteristics and portfolio allocations.  Back on June 8, I wrote a blog post titled “Smooth or Bumpy” highlighting the relative graphical path of the performance characteristics of short versus long corporate bonds.  Following is a summary of the specific traits and market dynamics that are causing this relationship, an update on how they have performed since then, and a review of how this translates into specific investment management for D&A clients.

Since I made that blog post, the paths have continued to exhibit those smooth or bumpy traits mostly defined by their underlying fixed income characteristics.  As I wrote back on April 24 in “Strategic Bond Math Explained”, bond returns are mostly a function of the effective duration of the bond portfolio and their inverse relationship to changes in interest rates.

In this case, both iShares Investment Grade Corporate Bond (LQD) and iShares 0-5 Year Investment Grade Corporate Bond (SLQD) hold true to their risk profiles.  The LQD duration of 8.71 years is almost four times as high as SLQD at 2.34 years making its total return performance four times as sensitive to changes in interest rates.  From the chart below, one can easily observe that LQD (the bumpy blue line) is more volatile than SLQD (the “smoothish” green line) with the paths closely following changes in interest rates over the time horizon.

So, the obvious question is, “How does this translate into investment strategy for a client portfolio?”  Bond exposure is usually added to a diversified investment portfolio to smooth returns over a time horizon to help an investor achieve their investment goals.  Most importantly, it is expected that bonds will exhibit a low or negative correlation to stocks when stock returns turn down (except, not this year!) thus reducing downside risk.  Of course, investors who have a high tolerance for risk and a long time horizon (such as young professionals with high earning potential) do not necessarily need any bond exposure at all!

At D&A, we strive to understand our client’s risk profile and time horizon so that their bond allocations are appropriate to help them achieve the goals.  In this case, due to the extreme risk differential between LQD and SLQD, all D&A clients with a bond allocation have a mix of both LQD and SLQD to help smooth their risk exposure.

"Don't Put All Your Eggs in One Basket"

You have all heard this a thousand times!  “Don’t put all your eggs in one basket” has been around a long time and simply talks to diversification as a means of risk reduction.  It is quite common for investors to have an emotional or other attraction to an individual stock or sector and request us to maintain/invest in a specific position and D&A has seen this from its clients over the years.  Following is a real case study of my personal experience (and how it went wrong!)

My wife worked for Verizon (VZ) for 30 years and got VZ shares as part of her 401-k package.  Verizon shares were used to match contributions so the balance grew quite large over time.  We were careful to trade out of the VZ shares periodically to ensure that the position did not grow too large, but we kept some shares so that we could take advantage of the Net Unrealized Appreciation (NUA) tax benefit (i.e., NUA allows the company shares to be taxed as long term capital gains instead of ordinary income upon distribution) when the time came.  We managed the exposure as “equity content” for asset allocation purposes.

The roads are littered with formerly well-performing companies/stocks that fell precipitously once hard times came thus decimating employees who held too much exposure.  General Electric (GE) comes to mind being down -56% over the most recent five years after being up +38% over the previous five years!

The total return performance of VZ has not been inspiring over the past 10 years!  As seen from the chart below, VZ has generated an average annualized total return of +4.9% compared to the S&P 500 (IVV) that was up +13.8%, a difference of 8.9%!  VZ’s return is just a bit better than a core bond position (AGG) that produced +1.6% return over this time horizon, but at 4 times the risk!  So this “equity content” performed like a bond with the “return per unit of risk” making this holding very suboptimal.

Fortunately, the VZ holdings were managed to a relatively small allocation so that its impact on my overall financial well-being was small.  The rationale to hold the VZ shares to take advantage of the NUA benefit did not work out since the potential tax benefit did not exceed the potential after tax return of just holding the S&P 500 and paying an ordinary income tax on withdrawals. I had a reasonable rationale to hold an individual stock, but my stock-picking, though not a disaster, was inefficient.

D&A does not pick individual stocks for its clients, preferring instead to invest in broad baskets of securities.  However, we believe there is nothing intrinsically wrong with holding individual stocks if a client desires it; just be certain to hold them in a diversified manner.

Black Gold?

Inflation started its spike back in March 2021 when annual inflation rates were at 2% then gradually increasing to 5%, 6%, 7% and then 9% in June 2022.  During this time, investment returns across most of the major asset classes have been muted, including some traditional inflation hedges.  Let’s take a look at a few of them!

Per the chart below, the performance of US crude oil (USO, the red line on top) has clearly been the top performer over this time horizon with a total return of +55.3%, but at twice the risk of other major asset classes!  In fact, over the last three years, oil has generated a negative total return of only -5.3% lagging most major asset classes, so it has not been an “investment for all seasons”.  During this most recent environment, however, oil has been the chief culprit in the inflation spike that filters through all aspects of the economy, so we should not be surprised that its price performance has been so high.

Other asset classes considered inflation hedges during this time horizon have not fared as well.  For example, conventional wisdom about gold (GLD) as an inflation hedge has not worked out too well with a total return of only +3.1%, underperforming the S&P 500 (IVV) with a return of +4.5% and real estate (VNQ) with a return of +7.8%.  On the bond side, U.S. Treasury Inflation-Protected Securities (TIP) have fared poorly as an inflation hedge with a +0.7% return.

At D&A, we prefer a broad-based globally-diversified portfolio management approach that focuses on major asset classes.  Consequently, we would almost never invest in oil or gold as an attempt at making a market call on inflation.  Our view is that client holdings in U.S. stocks and real estate as an inflation hedge with a complement of short duration bonds will play out over the long term.

Three Thoughts

Following are three summaries of items that interested me over the last week or so.

First, I am an ardent follower of the think tank and investment advisory firm Research Affiliates and I found their recent comments and analysis very interesting.  Following are the thoughts put forth by Vitali Kalesnik, PhD, Director of Research, Europe, of that firm where he expresses a cautious view of multiple recession indicators that he believes are currently present:

o   Higher interest rates

o   The prolonged Russia-Ukraine war, where sanctions are pushing energy prices higher and increased military spending will constrain other fiscal stimulus

o   Increased public infrastructure spending on renewables and, likely, nuclear power, further diverting governments away from other fiscal stimulus.

Secondly, Research Affiliates recently updated their Asset Allocation Interactive model and it suggests risk/return profiles for the major asset classes over the next 10-year horizon (see the chart below).  As shown, it indicates that investments in International Developed markets (EAFE), Emerging Markets , U.S. Small Cap and Europe are likely the highest returning AND highest risk asset classes.  U.S. Large Cap equities are forecast to underperform those asset classes, but still exhibit high risk.  The lower return (and lower risk) assets include broad U.S. Core bonds and U.S. high yield bonds.  So, no surprises here but interesting to see a model supporting a popular consensus and historical view.

And thirdly, you have all heard it from me many times to hold tight since no one can time the market, no one rings a bell when it is time to get back in, and based on history, long-term investors will be rewarded for sitting tight.  Echoing this thesis is a recent post from Fidelity investments titled, “Three Reasons to Stay Invested Right Now” with these thoughts:

1.      Market volatility is normal and stocks have historically recovered even from major downturns and delivered long term gains

2.      The best returns often happen when everything feels the worst

3.      Holding cash may also be risky due to inflation

In this environment it is best to ensure that your portfolio has some inflation protection built-in, that your bond exposure is appropriate, and your tolerance for risk is matched with your investment strategy.  At Dattilio & Ash we consider all these thoughts for all client accounts.

A "Sea of Red"

There are not too many good things to report for the second quarter of 2022.  In fact, the media reported that Q2 ended the worst first half of the year since 1970!  In a highly unusual occurrence, both stocks and bonds declined due to a confluence of shocks including heightened inflationary pressure, higher interest rates, risk of a slowing economy, and continuing supply chain disruptions, as well as fallout from the Russia/Ukraine war.  Though the sea of red numbers in 2022 is discouraging (see table below), it is encouraging to note that a longer term focus shows that the equity year-to-date total returns do not negate the positive values of the prior two years (except NOT for fixed income, though!).

The table shows large negative returns across all the major asset classes for Q2 and for the first half of the year.  Large cap U.S. equities (IVV) bounced off its low in mid-June but is still down -16.16% during Q2 and -20.00% YTD.  Small- and mid-cap equities (SCHA and SCHM) did worse during Q2 being down -17.36% and -16.92%, respectively.  Likewise, intl. developed and emerging market equities (SCHF/SCHE) were down but only a bit less.  Bonds also were down during Q2, but not as much as equities with core bonds (SCHZ, -4.79%), inv. grade corporates (LQD, -8.40%), and high yield bonds (HYG, -9.48%) continuing to be victims of higher rates/widening credit spreads due to inflation and a tightening Fed.

I wrote 11 blog posts during Q2 and they all dealt with weak market performance and how to cope with it.  As I have said many times and in my recent blog post, Spinning Wheel,

 “If you are employed, have a long time horizon, and have sufficient income/net worth to support your desired lifestyle, it is in your best interest to stay invested.  The trouble with getting out of the market now is that it will be harder to recover lost value when the market turns up again.  Also, we will then need to agree on the correct re-entry point (very difficult!)”

Spinning Wheel

 What goes up must come down
Spinning Wheel got to go 'round
Talkin' 'bout your troubles
It's a cryin' sin
Ride a painted pony
Let the Spinning Wheel spin

The lyrics from the Blood, Sweat & Tears song Spinning Wheel indicate a metaphor for the cycles we all go through.  Such is the experience we have seen in the capital markets recently.  Only a short week ago it appeared that all was lost and there was no hope, but this week the market delivered a rebound!

The chart below shows the cumulative value of the S&P 500 (IVV, the blue line) and its weekly returns (the orange bars).  As you can see, The S&P 500 has been in a volatile downward path since the beginning of the year.  In fact, before this past week, over the past 24 weeks the S&P 500 has had negative weekly returns 17 times and 10 of the past 11 weeks!   This week, however, we saw a nice +6.6% rebound.  The S&P 500 is still down -17.3% YTD, but the recovery did offer a pause in the negative market psychology.

Most of the recent market commentaries have bemoaned the troubling economic situation we are in; but it will not last forever!  When you have a long time horizon, this moment in time is simply a blip.  If you are employed, have a long time horizon, and have sufficient income/net worth to support your desired lifestyle, it is in your best interest to stay invested.  The trouble with getting out of the market now is that it will be harder to recover lost value when the market turns up again.  Also, we will then need to agree on the correct re-entry point (very difficult!)  As said by my peer in the industry:

 Scott Clemons, Chief Investment Strategist, Brown Brothers Harriman

“We’re trying hard to keep nervous investors in the market, reminding them that no one rings a bell at the end of a bear market, and that the recovery can be both swift and counterintuitive. In fact, the average return of the S&P 500 from the date of a bear market entry (not the trough, but the 20% trigger) is 23%. You don’t want to miss that.

 However, for nervous investors, we do point to the benefit that dividends offer, not just for cash flow, but as a market of a company with plentiful free cash flow and a strong balance sheet. Quality wins over time!”

 The prior week was the worst we have seen this year and this week was tied for the best (with May 27, 2022)!  All D&A client portfolios are made up of many core holdings of high-quality investments and are well-positioned to recover when the market recovers.  

No Zig

2022 has been a bust from almost the very beginning of the year.  Most telling has been the almost total lack of diversifying positions helping to smooth performance.  For example, bonds have performed almost as badly as stocks.  There has been no “zig” to offset the zag!

I have shown charts all year long showing the path of all major asset classes trending down.  The S&P 500 (IVV) hit a new low for the year yesterday, down -21.06%, while core bonds (AGG) were down -12.52%.  Naïve diversified portfolios tracked down in a similar fashion with the iShares Core Growth (AOR) ETF down -16.96% and the iShares Core Moderate (AOM) ETF down -15.51%!  No respite for the weary!

The causes for the weak capital market performance can be tracked to several things all occurring at the same time.  The external effects of the Russia/Ukraine war are most significant with impacts on oil and grain/food prices and the consequent impacts on inflation and global supply and demand.  Also, thought leaders point towards the lagged effect of excessive fiscal stimulus and Fed easy money policy in the wake of the global pandemic as another contributing factor to high inflation; with the Fed now “tightening” to try to slow the economy and quell inflation.  Again, with the consequent potential impact on economic growth and corporate earnings, we are seeing stock valuations and prices drop.

As bad as it has been, if you have a long time horizon (10 plus years) and capacity for risk (employed, with no need to tap your investments), history shows that “sitting tight” will reward the patient investor.  No guarantees, of course!